Price chart gives you the current price, high, low and total returns for the selected period. You can check the price chart for 1 day, 1 week, 1 month, 1 year, 5 years, max (since listed) or the SIP view.
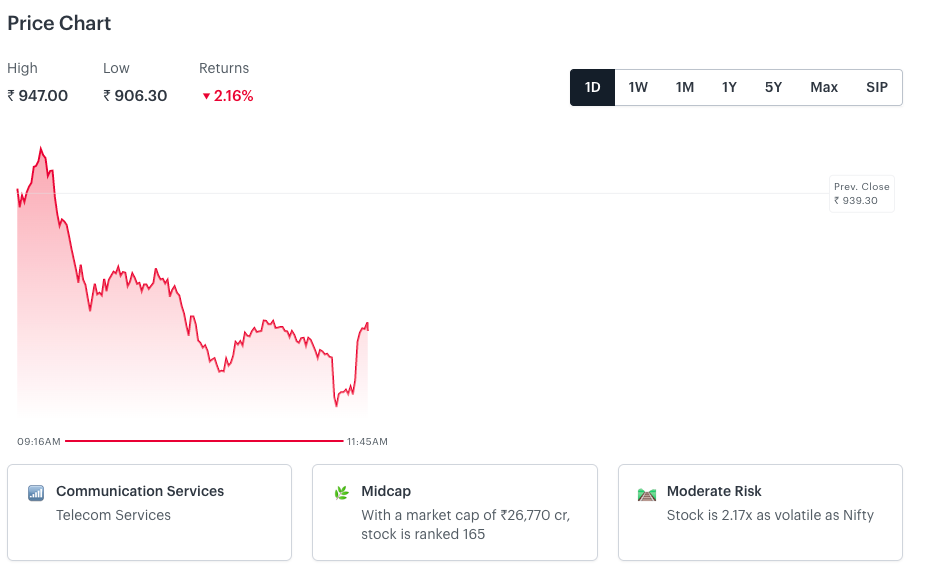
At the bottom of the chart you can see stock sector and sub sector (Communication service/Telecom service in the above pic), market cap(small, mid or largecap) and volatility (low, moderate of high).
SIP view shows a comparison of how your 100 INR SIP would look like today if invested at the time of listing of the stock.
